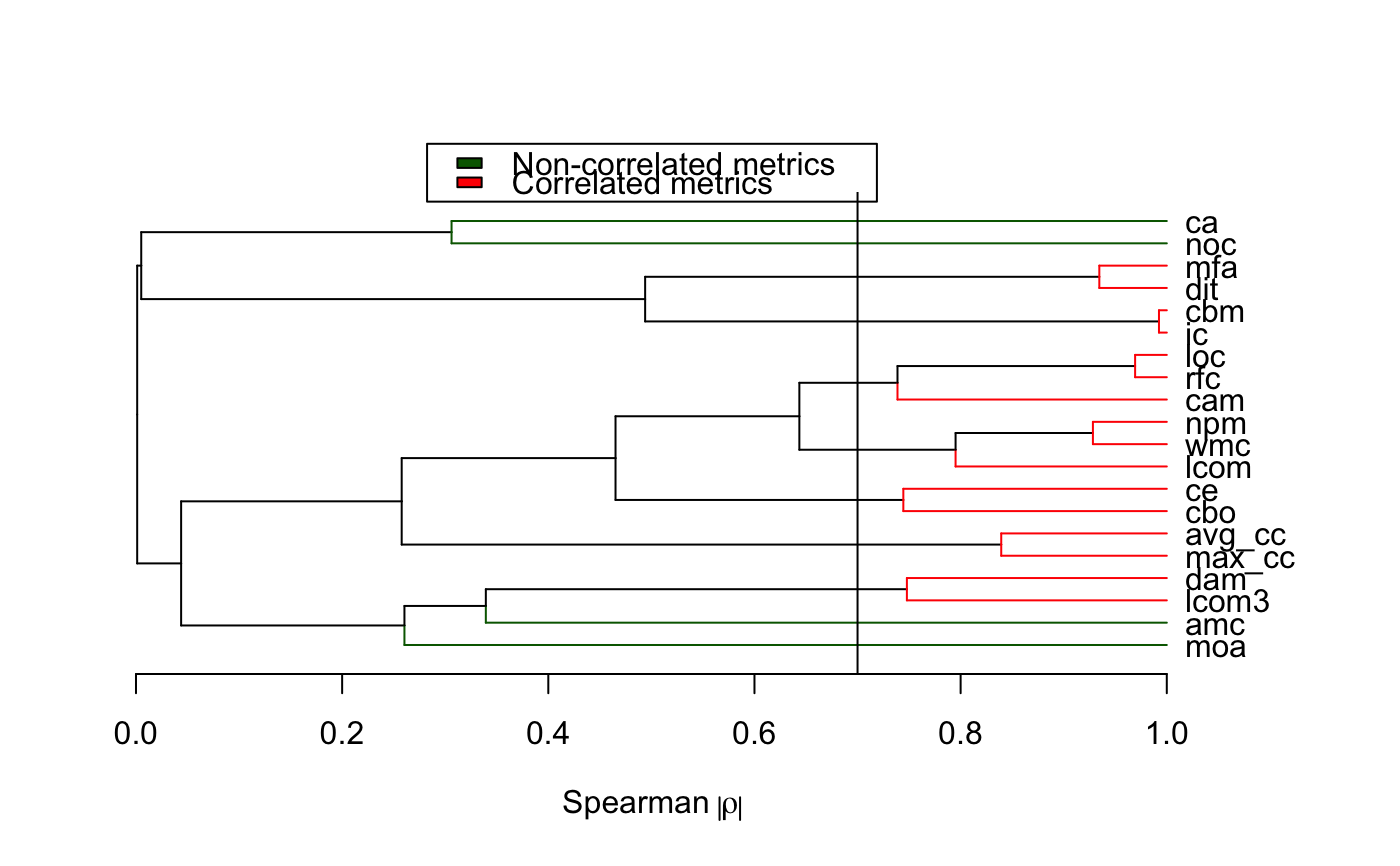
Get VarClus plot based on the absolute Spearman correlation coefficients between metrics
Source:R/plotVarClus.R
plotVarClus.RdThis function makes life simple by providing a VarClus plot.
plotVarClus(dataset, metrics, correlation = "spearman",
  correlation.threshold = 0.7)
Arguments
| dataset | a data frame for data |
|---|---|
| metrics | a vector of characters or a vector of characters for independent variables |
| correlation | a character for correlation measures (e.g., Spearman rank correlation), default = spearman |
| correlation.threshold | a numeric for correlation coefficient threshold value |
Examples
#> Warning: "labels" is not a graphical parameter#> Warning: "hang" is not a graphical parameter#> Warning: "labels" is not a graphical parameter#> Warning: "hang" is not a graphical parameter